
3.2 Well Data Window
3.2 Well Data Window: The well data window provides a consolidated view of the selected well parameters and operation. You can open the window in several ways: By clicking the…
The well data window provides a consolidated view of the selected well parameters and operation.
You can open the window in several ways:
-
By clicking the well tile in the well management pane.
-
By clicking the well tile on the heat map.
-
By clicking the well name in tables displayed in sections of the working area.
-
By clicking Go to well (
 ) in the alert data window.
To close the window and go back to the previous screen, click the arrow icon (  ) in the upper-left corner of the window.
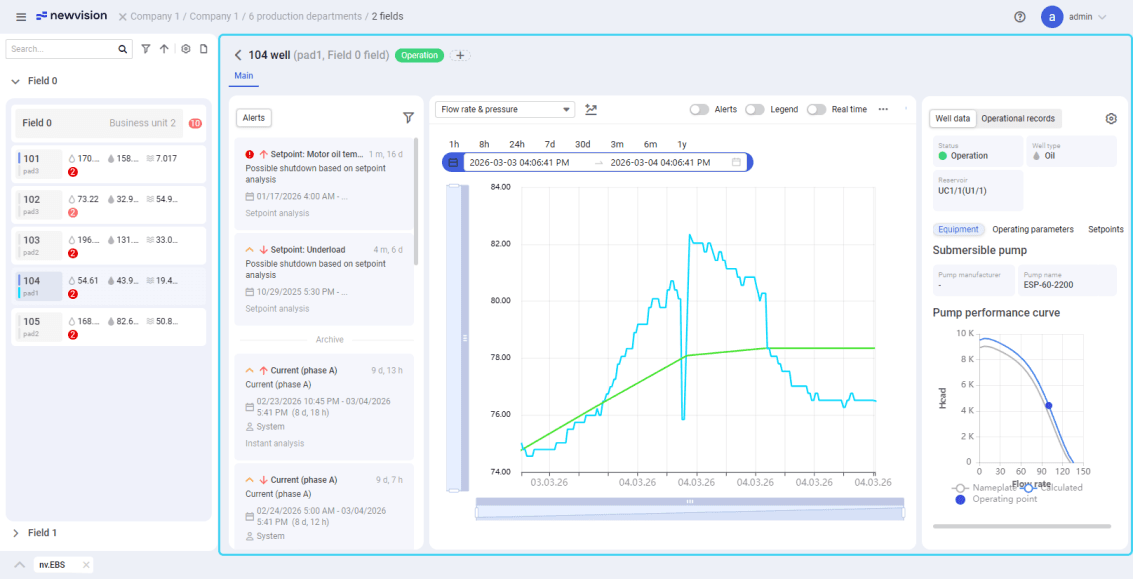 Select image to enlarge
The well data window consists of the following parts:
-
Header at the top of the window
-
Alerts pane in the left part of the window
-
Trend chart in the central part of the window
-
Well data and Operation records tabs in the right part of the window
Header
The well data header contains the name of the selected well and names of the pad and field to which this well belongs.
The header also provides information about the well's current operational status, displayed as a colored badge (  ). You can add custom badges by clicking the plus icon (
  ).
).
Alerts
The Alerts pane provides a list of all alerts generated for the well, both unconfirmed (pending) and confirmed (archive). For details, see Alerts.
To filter alerts in the list by their type and/or date, perform the following actions:
-
In the upper-right corner of the pane, click the filter icon (
 ). The filter window opens.
 -
In the window, under the Type heading, select check boxes of the desired alert types.
-
Under the Time range, click the date range picker, and then, in the window that opens, select the desired start and end dates.
-
At the bottom of the window, click Apply.
-
(Optional) To reset the filters, open the window and click Reset.
Alerts are displayed as tiles that contain the following data:
-
Alert severity level displayed as an icon:
-
Critical (
 )
) -
High (
 )
) -
Medium (
 )
) -
Low (
 )
)
-
-
Name of the parameter whose deviation triggered the alert and an icon indicating the direction of the change: increase (
 ) or decrease (
  ).
). -
Date and time of alert generation
-
Date and time of alert confirmation (for confirmed alerts)
-
Name of the user who confirmed the alarm (for confirmed alerts)
-
Alert type (Deviation analysis, Setpoint analysis, or Instant analysis)
Trend Chart
The trend chart provides visualization of the well operation parameters over the specified time range. To configure the displayed time range, at the top of the chart select one of the pre-defined options, or click the calendar icon (  ) in the left part of the date range picker, then click the date range picker itself and select the desired start and end points.
Configuration of the parameters displayed in the chart is defined by the template selected in the upper-left corner of the chart. Two default templates are available: Flow rate & pressure
and Frequency. For details on creating and editing templates, see Working with Chart Templates.
To add or remove parameters from the chart, to the right of the template list, click Add parameters (  ), and then, in the drop-down list, select or clear check boxes of the desired parameters.
In the upper-right corner of the chart, additional controls for the data display configuration are available:
Alerts
Displays alerts generated for the well as vertical dark gray lines on the chart. Alert details are available in the pop-up window that appears on hovering over the chart. For details, see Alerts.
Downtimes
Displays well downtime periods as vertical light gray lines on the chart. Downtime details are available in the pop-up window that appears on hovering over the chart. For details, see Downtimes.
Oper. records
Displays operational records as small transparent windows. Depending on the record settings, the window may contain the record subject, tags, and/or message. For details, see Working with Operational Records.
Legend
Displays the chart legend in the right part of the chart. The legend provides the ability to temporarily show or hide parameters in the chart. To do this, click the parameter name in the legend. Names of the visible parameters are displayed in black, names of the hidden parameters are in gray.
Real time
Enables real-time update of the chart data. If this option is turned on, the chart is updated as soon as the new measurements appear. Otherwise, the chart is updated on a regular basis every 15 minutes.
To expand the chart to full screen, in its upper-right corner, click Expand (  ). To collapse the expanded chart back to the original size, click Collapse (
  ).
).
Well Data
The Well data tab provides information about the well, such as installed equipment, operating parameters, and setpoints.
To configure data display on the tab, in the upper-right corner of the tab, click Settings (  ), and select or clear check boxes of the desired parameters.
At the top of the tab, general parameters of the well are displayed as tiles: status, well type, and reservoir.
Below, the following tabs are available:
-
Equipment: Characteristics of the equipment installed on the well.
-
Operating parameters: Parameters of the well operation. If the Forecast flow rate check box is selected in the well data settings, at the bottom of the tab, the Forecast flow rate area is displayed where you can calculate forecast values of the cumulative liquid flow rate. You can select the calculation horizon in the following ways:
-
Select one of the predefined calculation horizons (At end of day or At end of month).
-
Configure a custom horizon by clicking the date picker and selecting the desired date and time.
-
-
Setpoints: Values of the well parameters that are used as setpoints for monitoring the well operation. These values are obtained through integration and can be used for generating alerts via setpoint analysis algorithms. For details, see Configuring Setpoint Analysis Alerts.
Note
You can configure the display of parameters on the Equipment and Operating parameters tabs in the well data settings.
Operational Records
The Operational records tab contains a list of all operational records added for the well displayed as tiles and provides controls for adding new records. For details, see Working with Operational Records.
The operational record tile provides the following information:
-
Subject and message of the record
-
Date and time of the record creation
-
Name of the user who created the record
Depending on the record parameters, it may also contain the following elements:
-
Record tags (
 ): Shows the tags assigned to the record.
Note
You can filter the list of operational records by tags. For details, see Working with Operational Records.
-
Displayed on chart (
 ): Indicates that the record badge is displayed on the chart.
 -
Comments (
 ): Indicates the presence of comments and their number. To view comments to the record, click its tile. For details on adding comments, see Working with Operational Records.
On hovering over the tile of the record created by you, the Delete (  ) and Edit (
  ) icons appear. For details, see Working with Operational Records.