
3.1 Well Management Pane
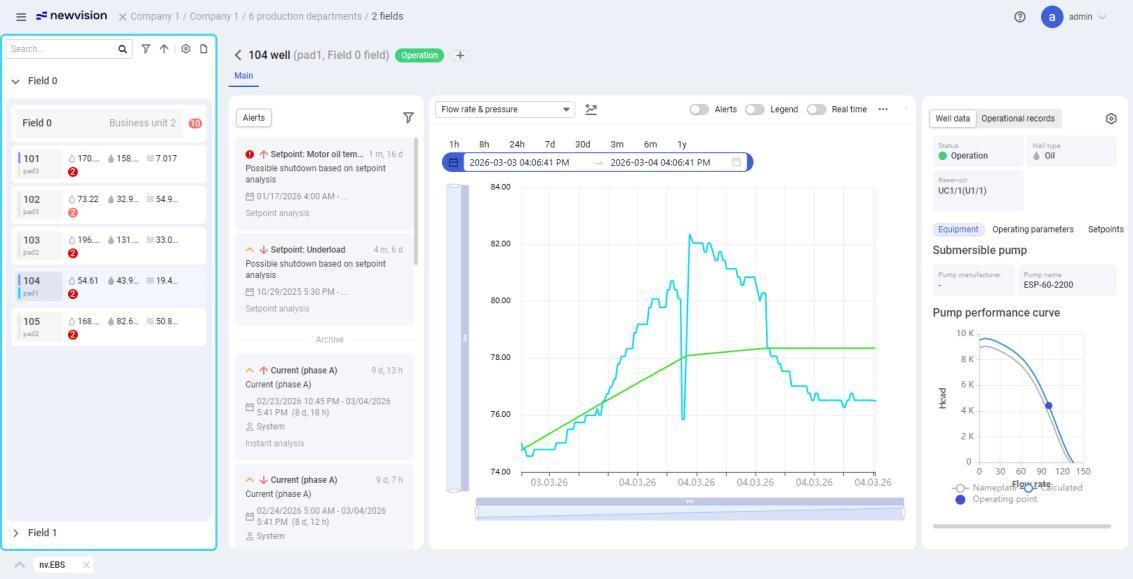
3.1 Well Management Pane: The well management pane provides a list of wells belonging to the business unit selected in the module and controls for their management. For details…
The well management pane provides a list of wells belonging to the business unit selected in the module and controls for their management. For details on the business unit selection, see Business Unit Selection.
 Select image to enlarge
Wells in the list are grouped by fields to which they belong. To expand or collapse the list of wells, to the left of the field name, click the arrow icon (  ) / (
) / (  ).
).
You can search for wells by their name or a part of it using the search field at the top of the pane. Search results are displayed in a drop-down list.
To view information about the well, click its name in this list. For details, see Well Data Window.
To the right of the field name, an icon with the total number of pending alerts is displayed. For details on the the icon colors, see below.
Wells in the list are displayed as tiles that provide the following data:
-
Virtual flow meter: Vertical line displayed on the left border. On hovering over it, a tooltip with a list of flow rate data sources appears: Measured data only or Virtual flow meter (ML model and/or Physical model). The color of the vertical line indicates if and what virtual flow meter models are enabled:
-
Light blue (
 ) / Gray (
  ): ML model is enabled/disabled.
 -
Dark blue (
 ) / Gray ( ): Physical model is enabled/disabled.
Note
The virtual flow meter provides calculated values of the liquid flow rate that are used for compensating outdated or missing measured data. For details on the virtual flow meter configuration, see Well Settings Window.
-
-
Well and pad names.
-
Liquid flow rate (
 ), oil flow rate (
  ), and water cut (
  ).
). -
Number of pending alerts: If there are unconfirmed alerts, their number is displayed on the icon. The icon color corresponds to the alert severity level: critical (
 ), high (
  ), medium (
  ), low (
  ). The green icon (
  ) indicates that there are no pending alerts. The icon color reflects the highest severity level of the well alerts, i.e. if there is one critical alert, two medium severity alerts, and three low severity alerts, the icon will still be colored as critical.
 -
First priority (
 ): Assigns the priority status to the well or, if it is already assigned, resets it. Priority wells are always displayed at the top of the list of wells so that you can monitor their condition.
 -
Well settings (
 ): Opens the window for configuring the selected well settings. For details, see Settings.
Note
The First priority (
) and Well settings ( ) icons are displayed only when you hover over the well tile.
At the top of the well list, the following controls are available:
Filter (  )
)
Allows you to filter the list of wells by fields and/or specific wells. To do this, in the drop-down list, select check boxes of the desired fields and/or wells. Wells are displayed as child nodes under the corresponding field nodes. To expand or collapse a list of wells, to the left of the field name, click the arrow icon (  ) or (
  ).
).
Sort (  )
)
Allows you to sort wells in the list by the values of one of their parameters in ascending or descending order. To do this, select the desired options under the Sort by and Sort order headings.
Settings ( )
Opens the Settings window where you can configure both common and well-specific settings. For details, see Settings.
Report (  )
)
Opens the window for configuring and generating reports on the well parameters. For details, see Reports.