3.4 Working Area: The working area of the nv.EBS module provides information about the wells belonging to the field that is selected in the well management pane. For details,…
On this page
The working area of the nv.EBS module provides information about the wells belonging to the field that is selected in the well management pane. For details, see Well ManagementPane.
Select image to enlarge
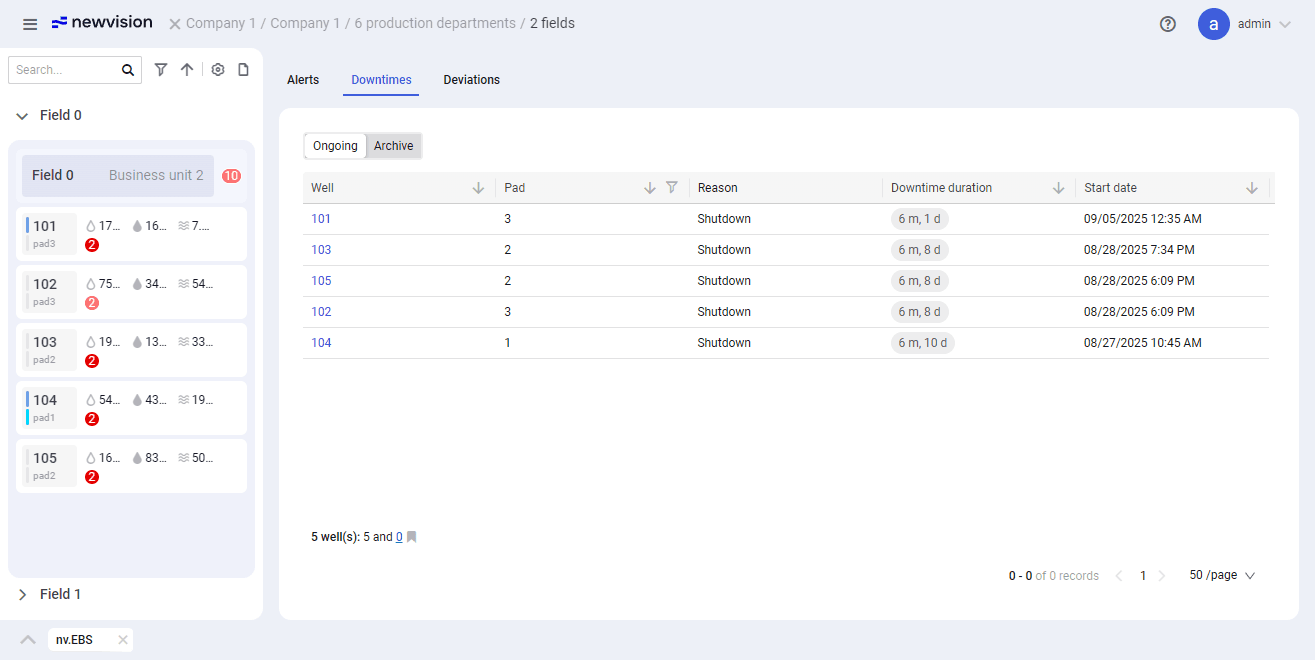
The working area consists of three sections displayed as tabs at the top:
The Alerts section provides information about alerts generated by the nv.EBS module based on the specified settings and limits.
Alerts are system notifications generated when specific changes in well parameters are detected. They are used to monitor well operation and to ensure timely response to identified deviations.
Alerts are considered pending until they are confirmed. After confirmation, they are moved to the archive. For details, see Alerts and Archive.
Alert generation rules are configured in the well settings and can be common for all wells or vary from well to well. For details, see Settings.
The Alerts section consists of the following tabs:
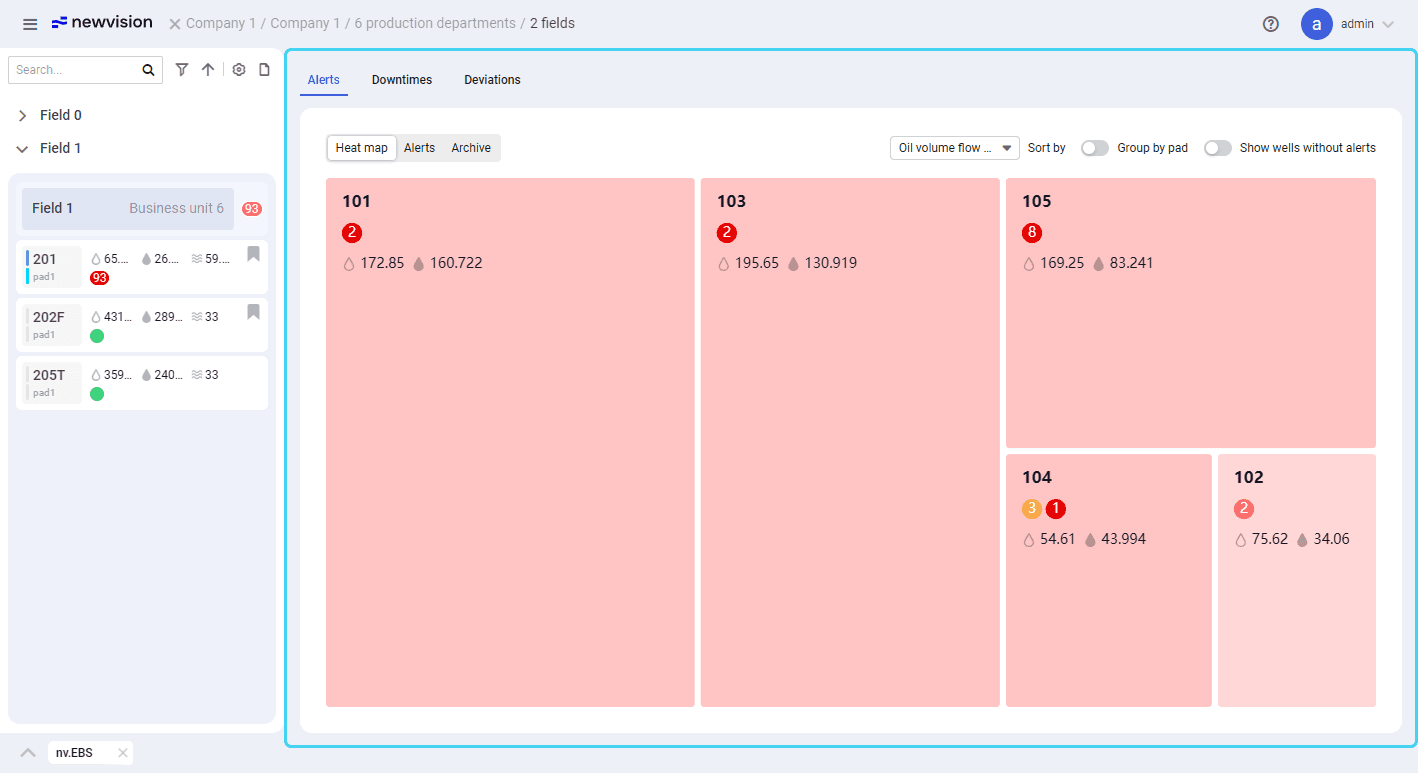
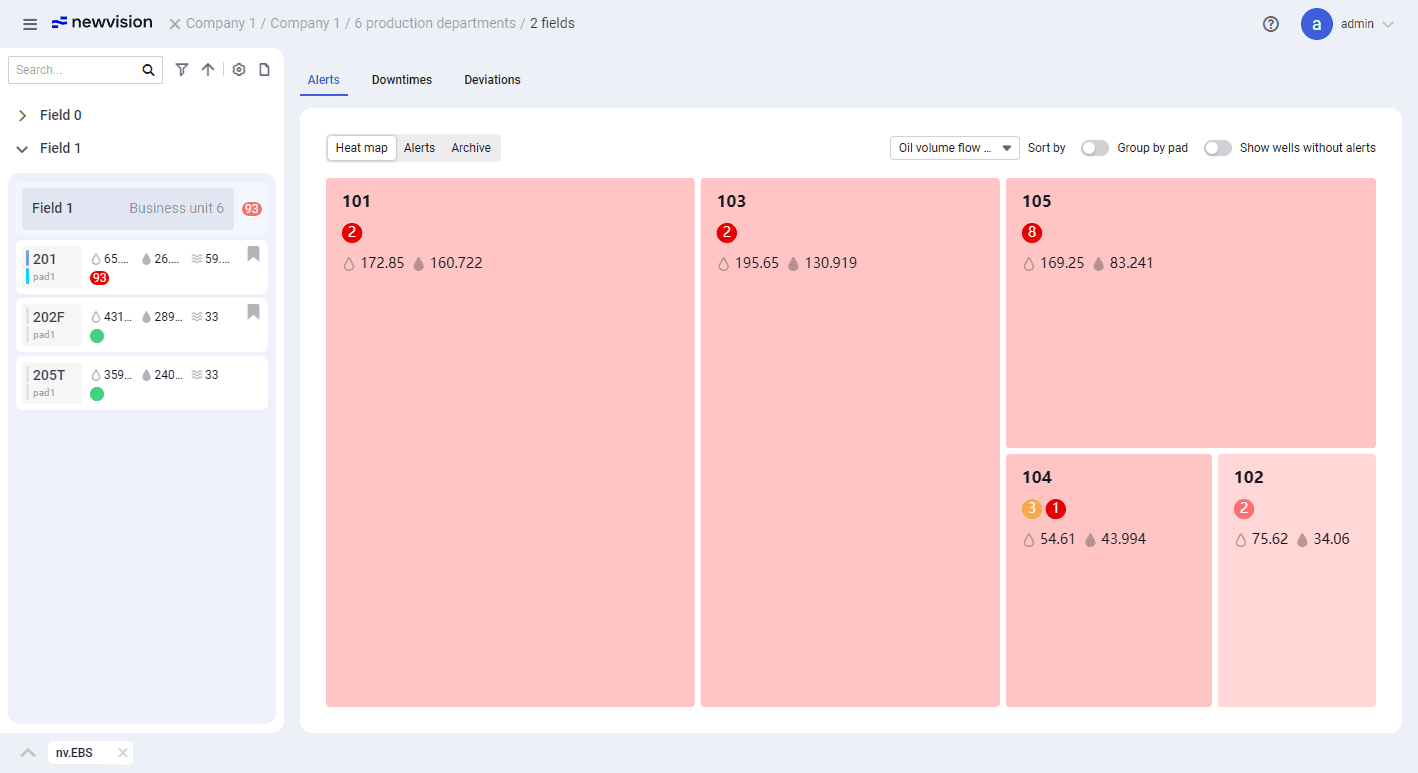
The Heat map tab provides visualization of the wells belonging to the field that is selected in the well management pane. For details, see Well Management Pane.
Select image to enlarge
On the heat map, wells are displayed as tiles. Their size corresponds to the value of the parameter selected at the top of the map (see description below). The tile color corresponds to the severity level of the alerts generated for the well (see description below).
The well tile provides the following information:
Well name
Number of pending alerts: If there are unconfirmed alerts, their number or numbers is displayed on the icon. For details on alert confirmation, see Alert Data Window. The icon color corresponds to the alert severity level: critical ( ), high ( ), medium ( ), low ( ). The green icon ( ) indicates that there are no pending alerts.
Note
Confirmed (archived) alerts are not considered.
Liquid flow rate () and oil flow rate ()
On hovering over the well tile, a pop-up window with an extended version of the same data is displayed.
Provides a list of parameters whose values can be used for the heat map generation and define the well tile size: the greater the value, the bigger the tile.
If enabled, wells are grouped by pads. In this case, instead of the well tiles, pad tiles are displayed with the data on all the wells within them summed up.
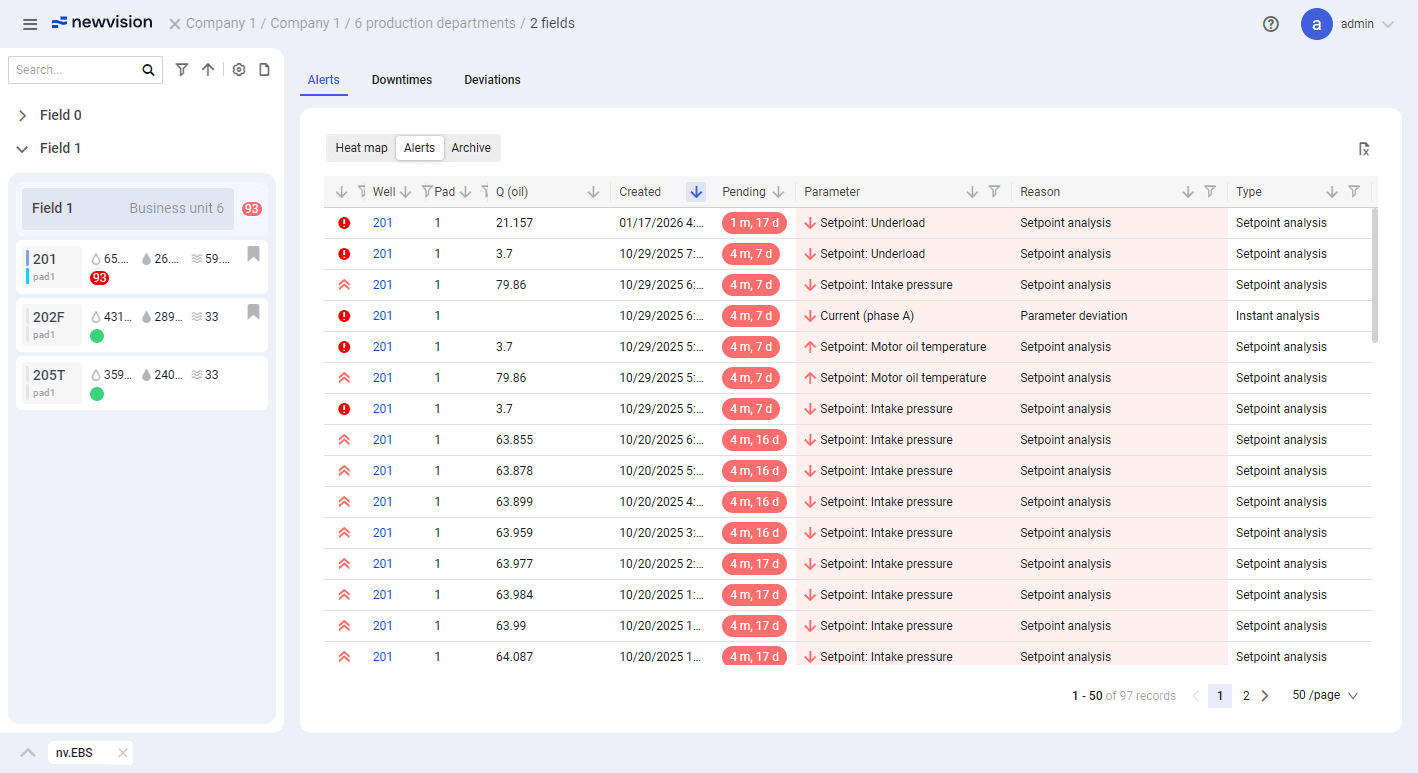
The Alerts tab provides a table with a list of all pending (unconfirmed) alerts. To confirm an alert and/or view its details, click the desired entry in the table. For details, see Alert Data Window.
Select image to enlarge
By clicking the well name in the Well column, you can open the well data window.
Icons in the leftmost column indicate the alert severity level:
Critical ( )
High ( )
Medium ( )
Low ( )
You can configure data display in the table by sorting and/or filtering its entries:
To sort entries in ascending or descending order, click the sort icon ( ) one or two times so that the icon changes its color to blue ( ). To clear a sort, click it again so that the icon color returns to gray.
To filter entries by the column content, click the filter icon ( ), and then, in the list of options that appears, select check boxes of the desired value or values, and click Apply. If filtering is configured, the icon changes its color to blue ( ). To clear a filter, open the list again and click Reset.
Note
Sorting can be applied only to one column at a time while filtering can be configured in multiple columns.
You can also export the table to an XLSX file. To do this, in the upper-right corner of the tab, click Export ().
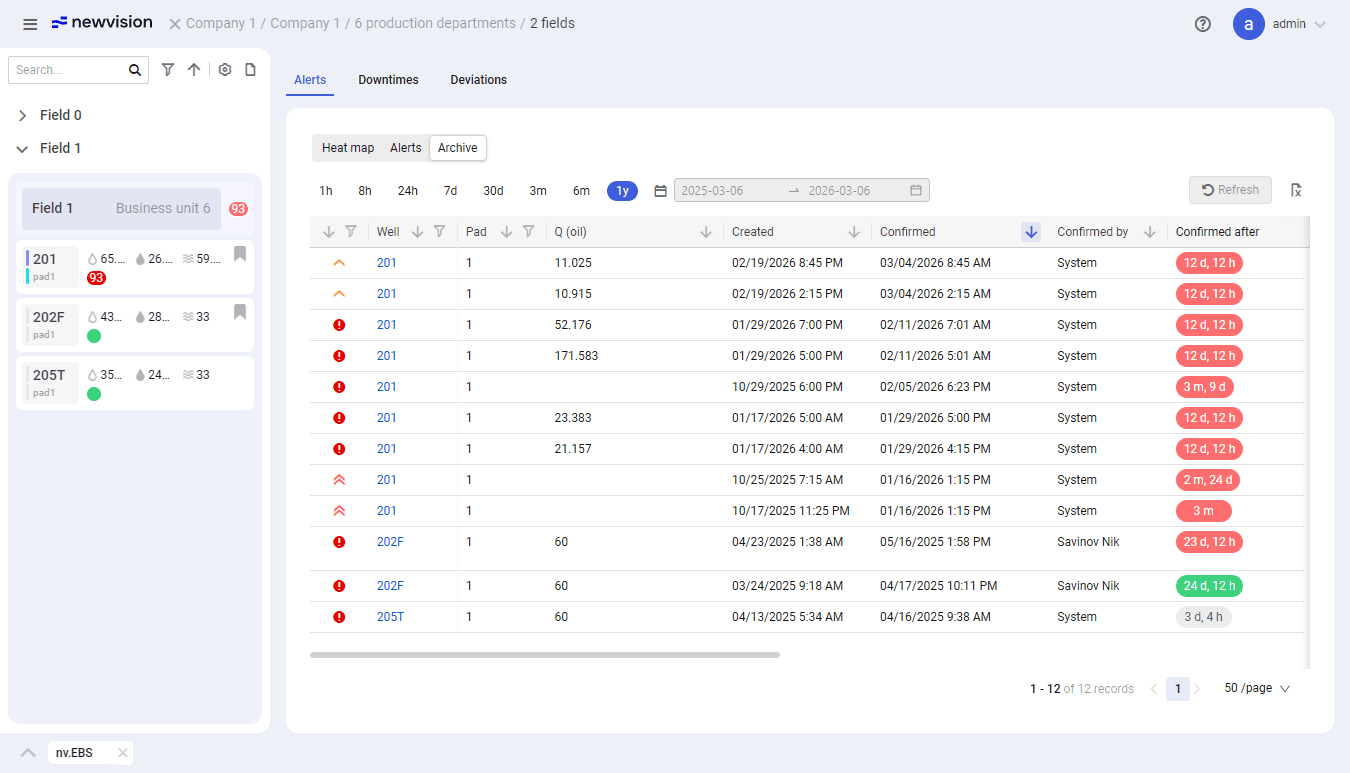
Deviation analysis alerts can also be moved to the archive automatically after the Auto-archive timeout period configured in the alert settings expires. For details, see Configuring Deviation Analysis Alerts.
Select image to enlarge
By clicking the well name in the Well column, you can open the well data window.
The tab interface is very similar to that of the Alerts tab. On this tab you can also set a time range so that the table displays only alerts for the selected period.
To do that, perform one of the following actions:
To select one of the predefined periods, at the top of the tab, click the desired option: 1h, 8h, 24h, 7d, 30d, 3m, 6m, or 1y.
To set a custom time range, click the calendar icon ( ) to the left of the date range picker, and then, in the window that opens, select the desired start and end dates.
You can configure data display in the table by sorting and/or filtering its entries:
To sort entries in ascending or descending order, click the sort icon ( ) one or two times so that the icon changes its color to blue ( ). To clear a sort, click it again so that the icon color returns to gray.
To filter entries by the column content, click the filter icon ( ), and then, in the list of options that appears, select check boxes of the desired value or values, and click Apply.
If filtering is configured, the icon changes its color to blue ( ). To clear a filter, open the list again and click Reset.
Note
Sorting can be applied only to one column at a time while filtering can be configured in multiple columns.
You can also export the table to an XLSX file. To do this, in the upper-right corner of the tab, click Export ().
We use cookies and similar technologies to run our website, understand usage, and support marketing. You can accept all, decline non-essential cookies, or manage your preferences. See our Cookie Notice and Privacy Notice for details.

 Select image to enlarge
 Select image to enlarge
 ), high (
  ), medium (
  ), low (
  ). The green icon (
  ) indicates that there are no pending alerts.
 ) and oil flow rate (
  )
) Select image to enlarge
 )
) )
) )
) )
) ) one or two times so that the icon changes its color to blue (
  ). To clear a sort, click it again so that the icon color returns to gray.
 ), and then, in the list of options that appears, select check boxes of the desired value or values, and click Apply. If filtering is configured, the icon changes its color to blue (
  ). To clear a filter, open the list again and click Reset.
 ).
).Select image to enlarge
 ) to the left of the date range picker, and then, in the window that opens, select the desired start and end dates.
Select image to enlarge