
Well information and multiphase flow
Well information and multiphase flow: 5.1.1 Well Information The Well information section provides general information about the well. It consists of two tabs: Well data…
On this page
5.1.1 Well Information#
The Well information section provides general information about the well. It consists of two tabs:
5.1.1.1 Well Data#
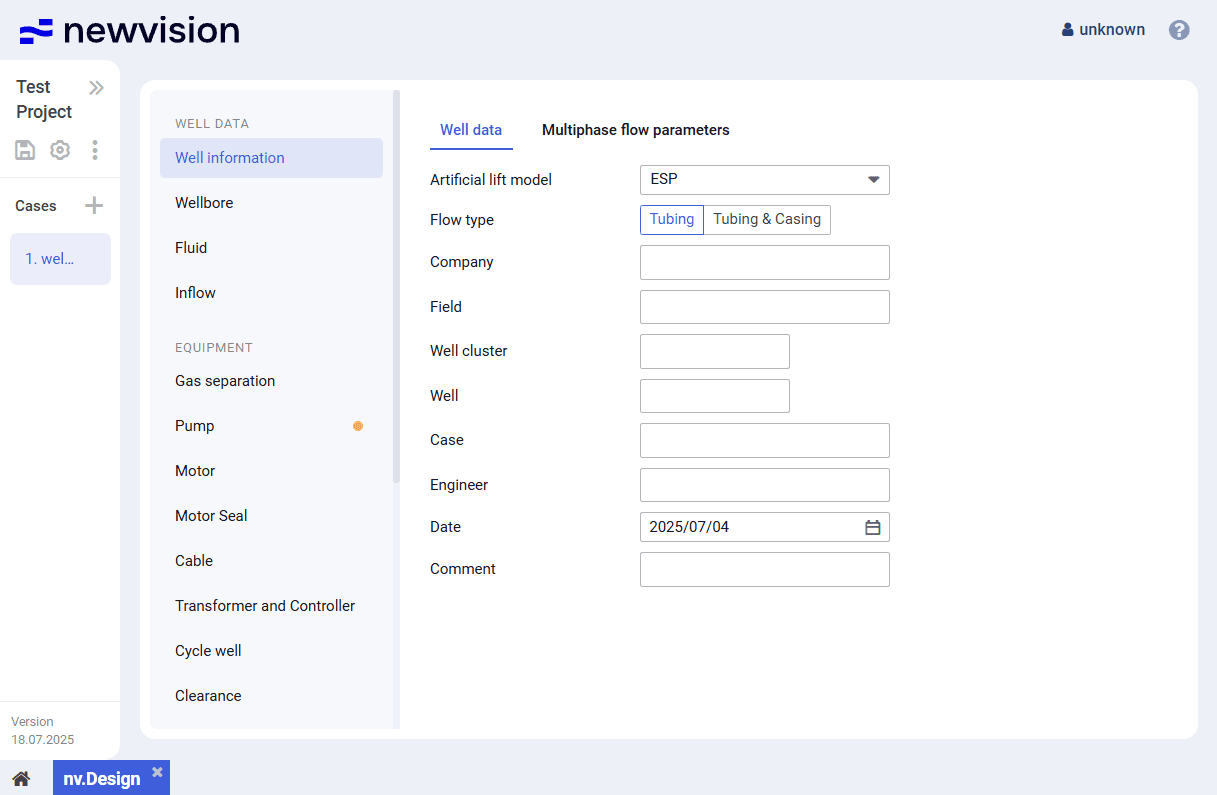
On the Well data tab, you can select the well lift type and enter general information about the well, such as company name, field name, well number, etc.
 Select image to enlarge
5.1.1.2 Multiphase Flow Parameters#
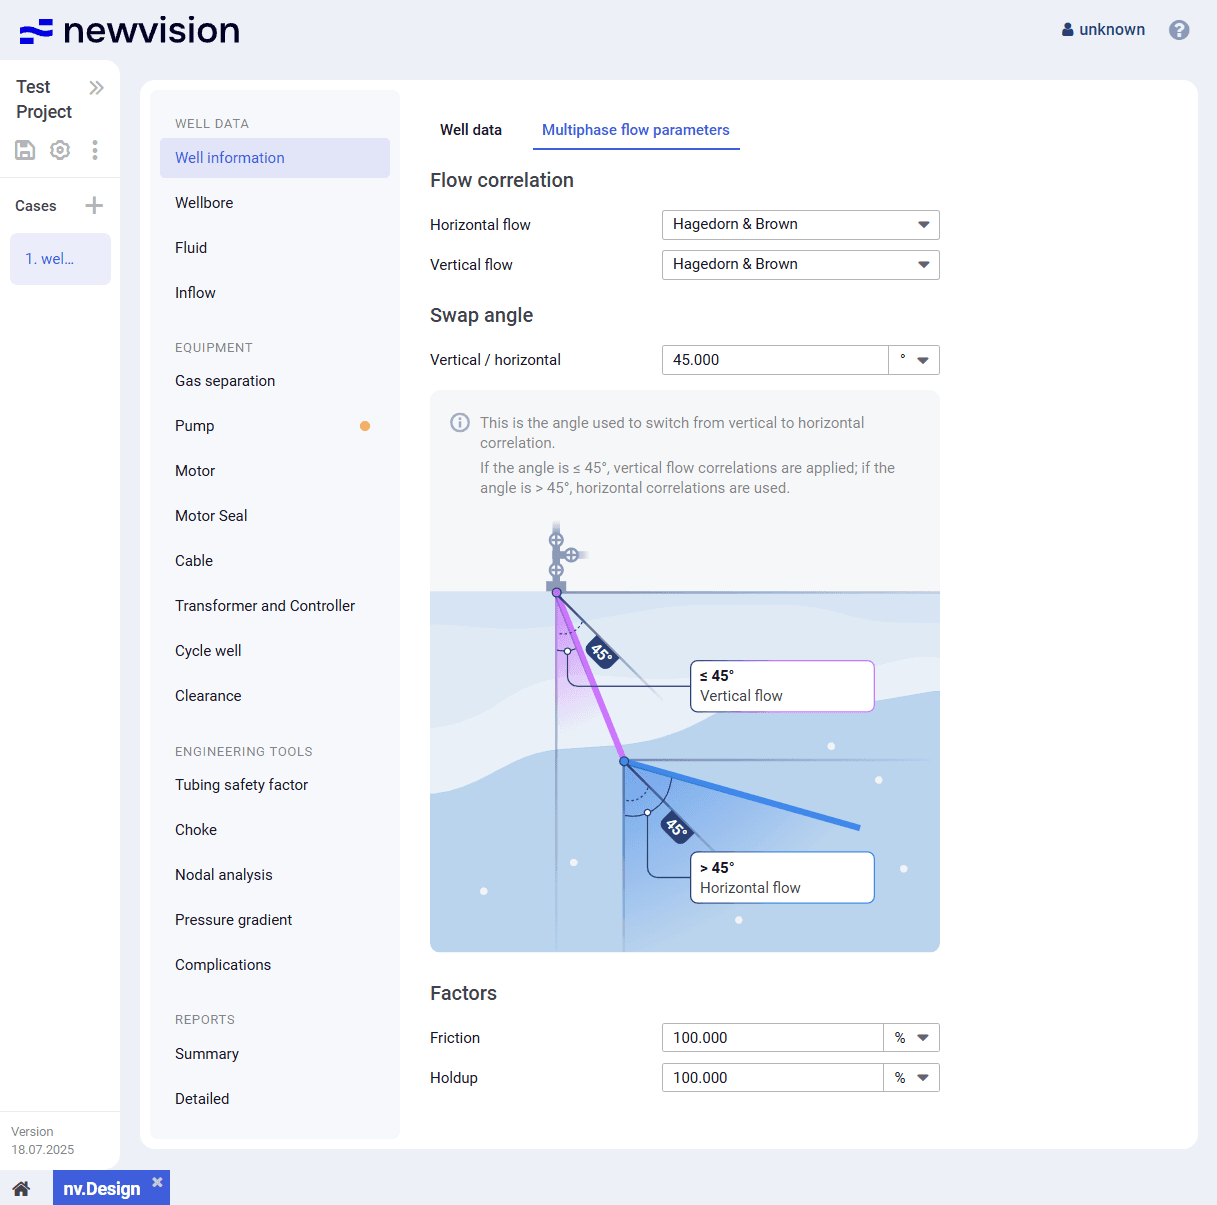
On the Multiphase flow parameters tab, you can select correlations used for the tubing multiphase flow and configure their application conditions.
 Select image to enlarge
The tab contains the following parameter groups:
- Flow correlation
- Angle of transition between flows
- Factors
Flow Correlation
In this group, you can select correlations that will be used for the horizontal and vertical flow calculations. For details on the available correlations, see Multiphase Flow Correlations.
Angle of Transition Between Flows
In this group, you can set the threshold inclination angle at which the system switches between horizontal and vertical flow correlations.
Below the field with the angle value, a simplified flow scheme is displayed. It visualizes horizontal and vertical flows and the selected transition angle.
 | Note Switching between correlations is important because different flow regimes and pressure loss behaviors are observed depending on the pipe inclination. This automatic switch provides more accurate modeling of pressure losses and flow behavior in deviated and directional wells. |
Factors
In this group, you can specify the friction and hold-up factors. They can be used to adjust pressure loss calculations in the wellbore:
- Friction factor affects frictional losses (ΔPf).
- Hold-up factor affects the hydrostatic gradient (ΔPa).
The total pressure loss is calculated using the following formula:
ΔP = (friction factor ΔPf) + (hold-up factor⋅ΔPa) + ΔPg
ΔP = (friction factor⋅ΔPf) + (hold-up factor ΔPa) + ΔPg
| Note This is a generalized formula. The exact formula for each component depends on the selected flow correlation. |
The default value for both friction and hold-up factors is 100%. You can modify it in calibration and testing purposes.
5.1.1.2.1 Multiphase Flow Correlations
On the Multiphase flow parameters tab of the Well information section, the following multiphase flow correlations can be selected:
Moody
The Moody correlation is used to calculate friction factors and pressure losses in single-phase flows of gas or liquid, based on Reynolds number and relative pipe roughness. While it was originally developed for single-phase conditions, it is often incorporated into multiphase models to estimate friction factors in each phase separately.
Typical data ranges:
- Temperature: 4°C – 177°C
- Pressure: 0.1 bar – 689 bar
Gray
The Gray correlation accounts for the influence of gas-liquid interaction in multiphase flow, specifically designed for pressure drop estimation in gas-lift operations and vertical wellbores. It is well suited for calculating bottomhole pressure and tubing performance where the gas-liquid ratio significantly affects flow behavior.
Typical data ranges:
- Temperature: 4°C – 150°C
- Pressure: 6.89 bar – 345 bar
- Gas-liquid ratio: Broad range typical for gas-lift systems
Poettmann-Carpenter
The Poettmann-Carpenter method was one of the first empirical models to incorporate the effects of two-phase flows in vertical wells. It estimates pressure losses in tubing based on flow rates and pipe dimensions, enabling basic evaluation of artificial lift performance and production behavior.
Typical data ranges:
- Temperature: 4°C – 177°C
- Pressure: 0.1 bar – 689 bar
Orkiszewski
The Orkiszewski correlation is widely applied in vertical multiphase flow modeling. It accounts for flow regime transitions (bubbly, slug, annular, segregated) and includes corrections for different flow patterns. This makes it valuable for pressure drop predictions in well design and production optimization.
Typical data ranges:
- Temperature: 4°C – 177°C
- Pressure: 0.1 bar – 689 bar
Griffith
The Griffith correlation is applied to vertical two-phase flows, particularly in wellbores. It considers gas-liquid interaction and offers a simplified method to calculate pressure losses based on mixture properties and flow regime assumptions.
Typical data ranges:
- Temperature: 4°C – 177°C
- Pressure: 0.1 bar – 689 bar
Duns & Ros
The Duns & Ros correlation evaluates pressure losses in vertical and inclined multiphase flow, accommodating various flow regimes including bubbly, slug, and annular. It provides accurate results for high gas-liquid ratio conditions that are often encountered in oil wells.
Typical data ranges:
- Temperature: 4°C – 177°C
- Pressure: 0.1 bar – 689 bar
Beggs & Brill
The Beggs & Brill correlation was developed for multiphase flows in pipelines with different inclination angles. It offers regime-specific calculations for pressure losses in horizontal, vertical, and inclined sections. This correlation is widely adopted due to its flexibility and applicability to field-scale models.
Typical data ranges:
- Temperature: 4°C – 177°C
- Pressure: 0.1 bar – 689 bar
Aziz
The Aziz model is designed for predicting multiphase pressure gradients in inclined and horizontal pipes. It captures complex gas-liquid interactions and adjusts for pipe angle, making it effective in pipelines and horizontal wellbores.
Typical data ranges:
- Temperature: 4°C – 177°C
- Pressure: 0.1 bar – 689 bar
Ansari
The Ansari correlation offers a mechanistic approach for predicting pressure drop, velocity, and flow distribution in vertical and inclined wells. It integrates flow regime transitions and detailed physical modeling to make it suitable for high-accuracy production system simulations.
Typical data ranges:
- Temperature: 4°C – 177°C
- Pressure: 0.1 bar – 689 bar
Hagedorn-Brown
The Hagedorn-Brown correlation is one of the earliest and most widely used models for vertical two-phase flows in oil wells. It enables reliable calculation of pressure losses based on well depth, fluid rates, and tubing diameter, serving as a benchmark for many commercial software implementations.
Typical data ranges:
- Temperature: 4°C – 177°C
- Pressure: 0.1 bar – 689 bar