
Area 3. Decline Curve Plots
 Select image to enlarge
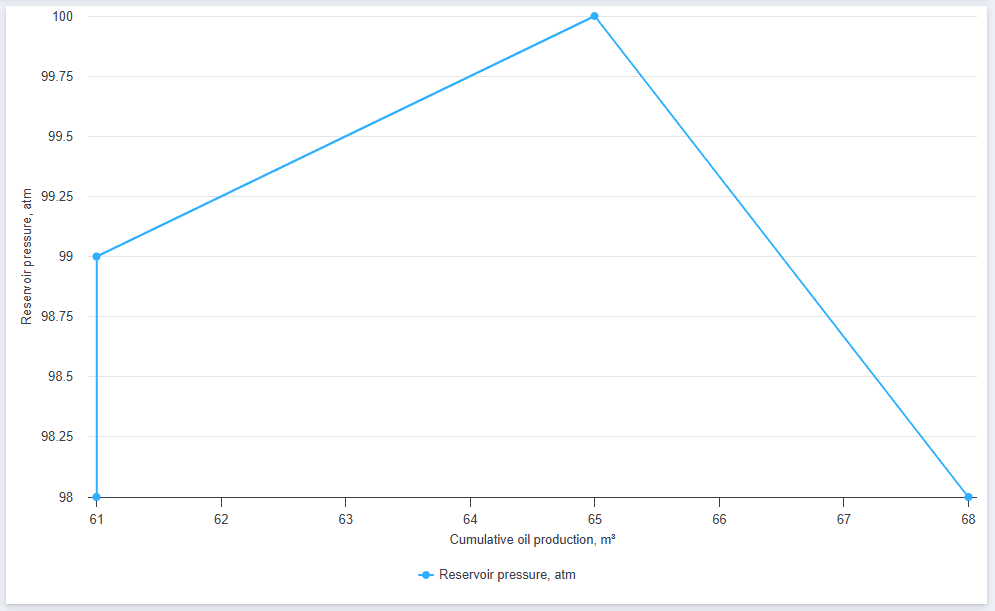
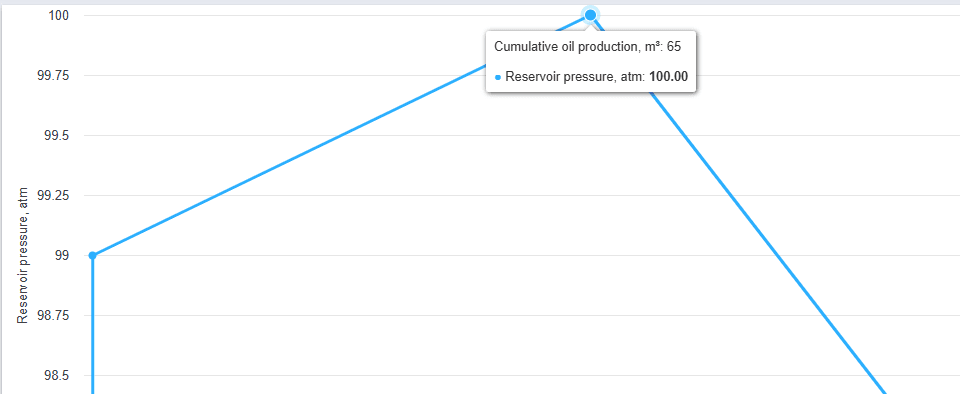
Pressure curves are displayed graphically. The X-axis label changes depending on the selected curve type. The plot has a point tooltip that displays cumulative production and reservoir pressure values.
Or reservoir pressure and date if the curve type is "Date".
 Select image to enlarge